
The Boise metro real estate market has captured national attention in recent years. A surge in demand fueled rapid price increases, making it a prime example of the pandemic housing boom. As we settle into 2024, the market is experiencing a period of transition. Recent events like the Federal Reserve Meeting, BRR’s February Stats, the FHFA’s Q4 UAD Report, and my weekly Boise Housing Tracker will shed light on the trajectory of this recent transition, so you can leverage this knowledge to achieve your real estate goals.
The Fed Factor:
The recent Federal Reserve meeting, where interest rates were kept steady, plays a crucial role. The Federal Open Markets Committee (FOMC) stated that it “does not expect it will be appropriate to reduce the target range until it has gained greater confidence that inflation is moving sustainably toward 2%.” Earlier in March, Fed Chair Jerome Powell emphasized that the bank needed “just a bit more evidence” that inflation was under control before cutting rates. Fed officials are still penciling in three quarter-point rate cuts this year. While the projections of the policy rate for 2024 didn’t change, policymakers expect fewer cuts in 2025 and 2026 than were projected in December. In other words, lower interest rates are coming, however they will take longer to materialize and likely will not drop as low as initially projected over the next few years.
Boise Regional Realtors (BRR) February Stats:
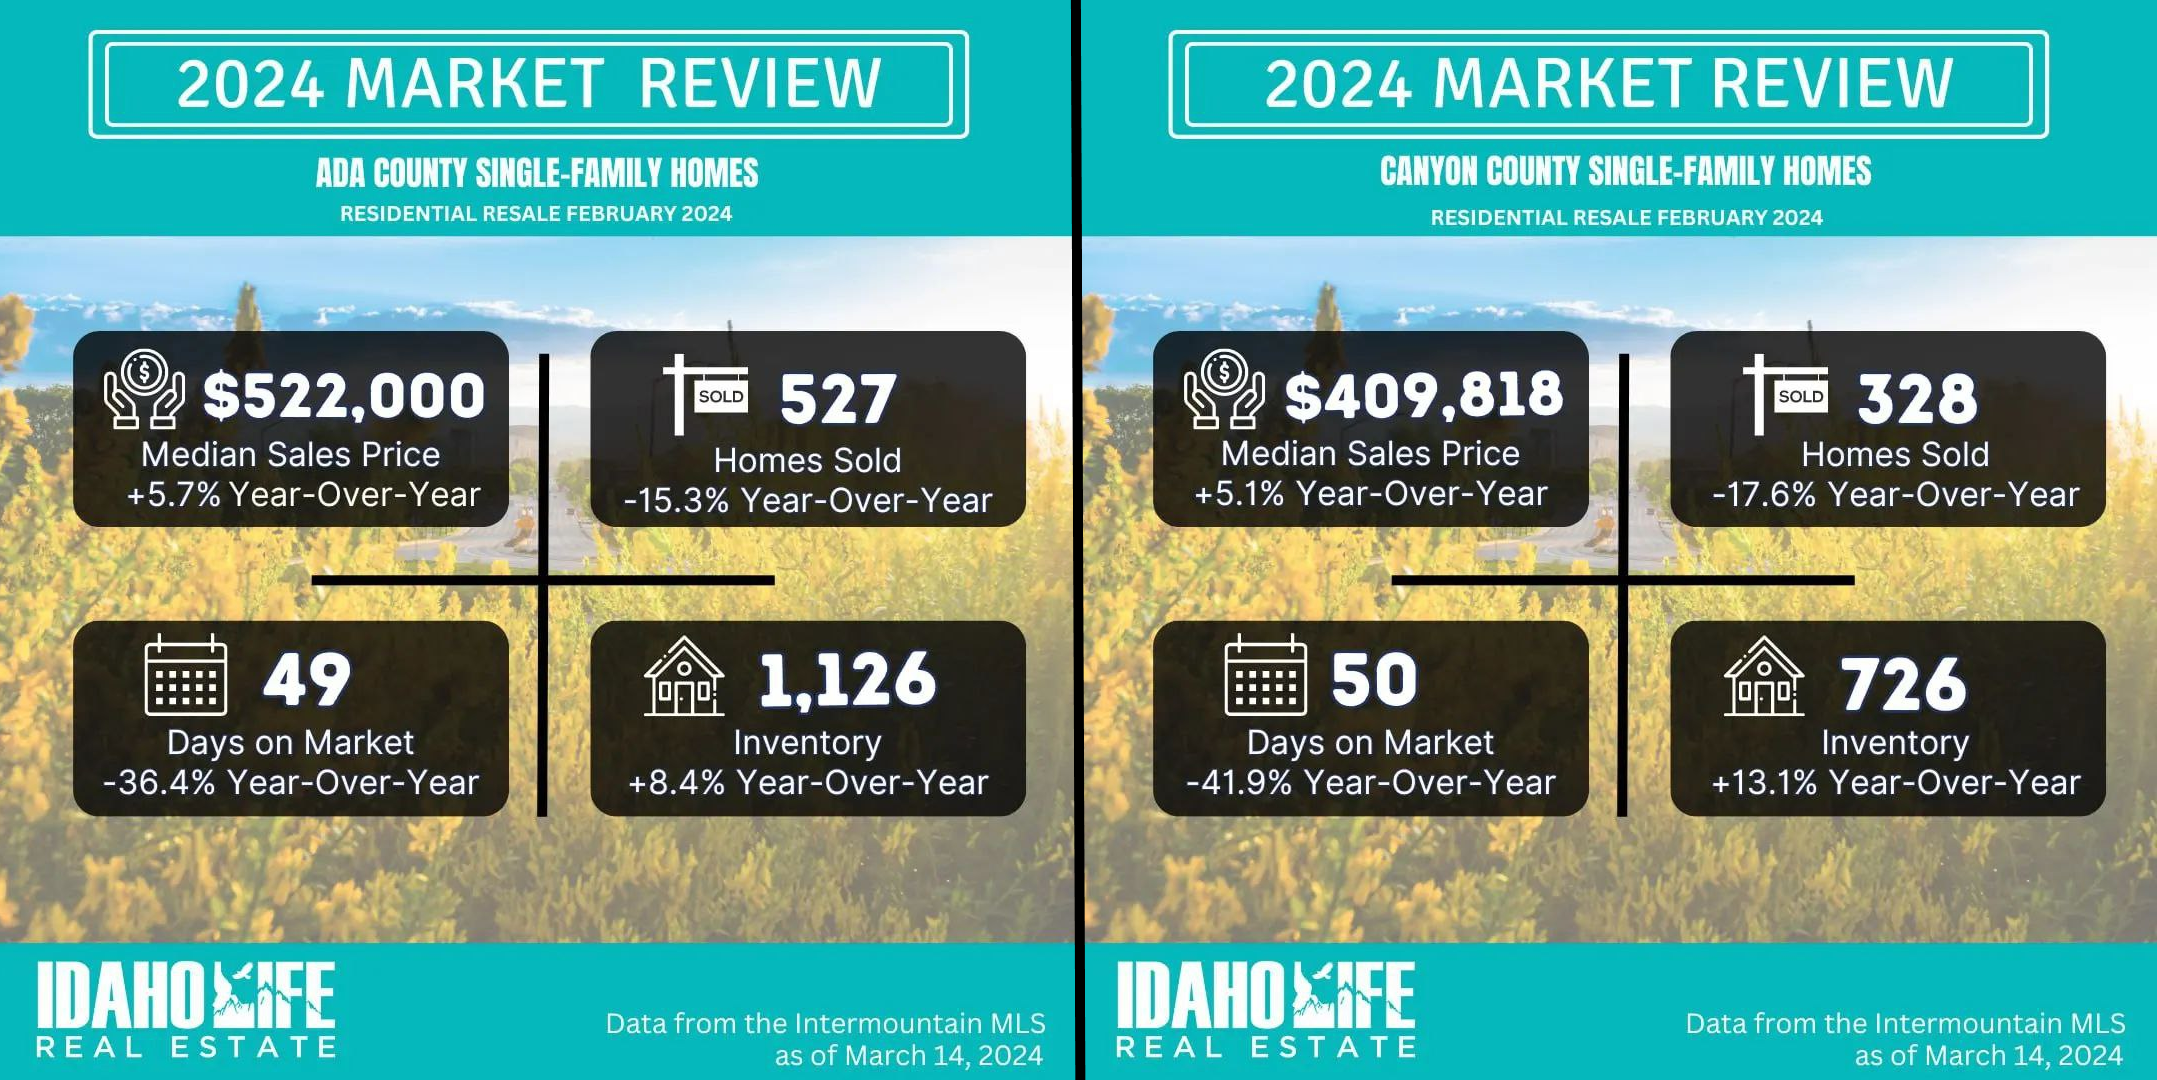
February 2024 data from BRR paints a picture of a Boise market in a state of moderation. The overall volume of sales is down, while inventory is increasing. Days on Market for Ada and Canyon counties in nearly identical, as is the appreciation rate of sales prices. This represents a healthy, recovering market. We are coming off of historic lows in sales volume and demand, following rapid interest rate increases. The breakneck pace of price increases has slowed, replaced by a more balanced market with increased inventory.
The Weekly Tracker:
While monthly data can be helpful, I have found tracking weekly metrics can be extremely beneficial for both buyers and sellers. The subtle shifts of weekly fluctuations can signal shifts in the market and allow buyers and sellers to take advantage of those changes before the monthly data is even calculated. For example, 7 of the last 8 weeks have seen inventory increases when compared to the same week last year. Early signs like the price reduction jump in week 11 directly correlate to the rise in new pending sales for week 12. I suspect we will see a rise in new sold data in the coming weeks when those pending sales close. The interconnectivity between these 4 important metrics can help both buyers and sellers determine the most beneficial time to enter the market.

The FHFA’s UAD Statistics: Unpacking the National Landscape
The Federal Housing Finance Agency’s (FHFA) recent Q4 2023 UAD statistics offer valuable national and regional context. The report indicates a nationwide slowdown in home price growth, echoing the trend in Boise. This reinforces the notion that Boise is not operating in isolation, but rather part of a national shift. Boise is #84 of the top 100 metro areas in the nation, according to FHFA. Median appraised values saw a 1.0% increase from $470k to $474.5k in Q4 2023. A key takeaway from the UAD report is the return to pre-pandemic levels of appraisals that fall below the contract price. The percentage of low appraisals spiked sharply during the price volatility in 2020 and 2021 to well into the double digits. Low appraisals can wreak havok on real estate transactions, causing them to be delayed or fall apart completely. The national average for appraisals that come in below contract price is ~10%. Both Ada and Canyon counties are below the national average again, which is a great thing for both buyers and sellers.
Conclusion: Data as Your Guide
As the Boise market navigates this period of moderation, data-driven insights are more valuable than ever. By understanding the trends – both locally and nationally – you can make informed decisions about your real estate journey. Whether you’re a buyer looking for the right opportunity or a seller navigating a changing market, knowledge is power.
Disclaimer: The weekly tracker is a live, continuously updated chart. The details discussed within this blog post are current as of 3/25/24, but could change as the graph evolves when additional data is added throughout the rest of the year.


Leave a comment